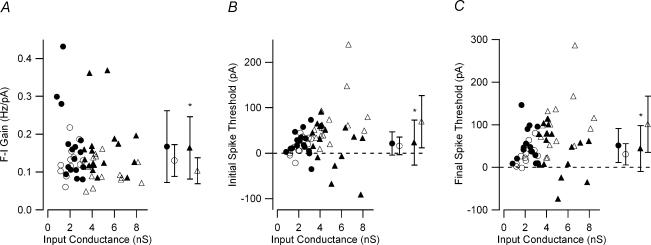
Figure 4. Effect of input conductance on measured firing properties.
A, the F–I gain for low-input conductance G93A (•) and control (○) and high-input conductance G93A (▴) and control (▵) motoneurones is shown. Only the high-input conductance sample had F–I gains significantly different. High-input conductance: G93A, 0.164 ± 0.082 Hz pA−1; control, 0.103 ± 0.034 Hz pA−1; low-input conductance: G93A, 0.167 ± 0.095 Hz pA−1; control, 0.130 ± 0.042 Hz pA−1. B, similar to the F–I gain, input conductance-related changes were observed in the current threshold for the initial spike. High-input conductance: G93A, 23.35 ± 49.49 pA; control, 69.38 ± 57.32 pA; low-input conductance: G93A, 21.33 ± 25.38 pA; control, 15.82 ± 19.61 pA C, input conductance-related changes were observed in the current threshold for the final spike. High input conductance: G93A, 43.96 ± 53.8 pA; control, 101.07 ± 65.98 pA; low-input conductance: G93A, 51.52 ± 39.68 pA; control, 30.73 ± 24.86 pA. A significant difference in the current thresholds was only observed in the high-input conductance G93A motoneurones. In each panel on the right side, the mean ±s.d. values are shown; *P < 0.05.

