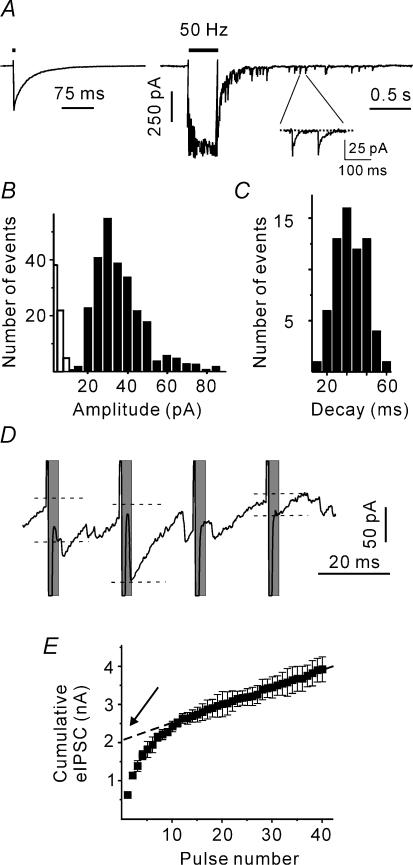
Figure 1. Estimation of synaptic transmission parameters.
A, sample trace representing a single eIPSC and a compound postsynaptic response induced by a train of 20 pulses delivered at 50 Hz (mouse at P1). Stimulation artefacts were partially blanked for clarity. The inset shows delayed IPSCs (dIPSCs) selected for the calculation of the dIPSC decay time constant. B, dIPSC amplitude histogram. Open columns show the noise distribution. C, distribution of dIPSC decay time constants. D, eIPSCs during the late phase of stimulation protocol. Only events that occurred within a 3-ms interval after the stimulus termination (shaded areas) were selected as eIPCSs. To measure the eIPSC amplitudes (shown by dashed lines), a linear fit of the decay of the preceding IPSC was first subtracted from each event. E, cumulative eIPSC amplitude during a 50 Hz train. The dotted line represents a linear fit to the last 20 stimuli during the train back-extrapolated to time 0. The y intersect gives an estimate of the RRP in the absence of pool replenishment.

