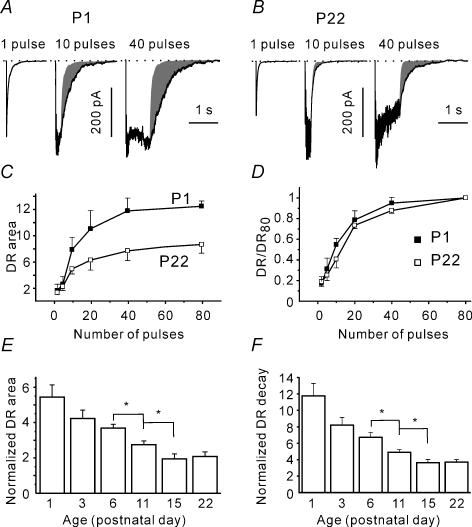
Figure 8. Developmental reduction in delayed release.
A and B, postsynaptic responses elicited with a single pulse and with trains of 10 and 40 pulses at P1 (A) and P22 (B). Shaded area represents the delayed response. C, dependence of normalized charge transferred after the termination of stimulation on the number of pulses in a train. The delayed response was normalized to the mean charge of the dIPSCs and the RRP size (n = 5–15). D, at different ages (P1 and P22 shown), the delayed responses exhibit a similar dependence on the train duration. For each cell, the DR values were normalized to the DR response elicited with an 80 pulses train. Same data set as in C. E, DR declined during development. For each cell, the delayed release area was normalized to the dIPSC area and the RRP. F, DR decays faster at older age. The decay of the asynchronous release was fitted by a single exponential function. For each cell, the obtained time constant was normalized to the mean dIPSC decay time constant.

