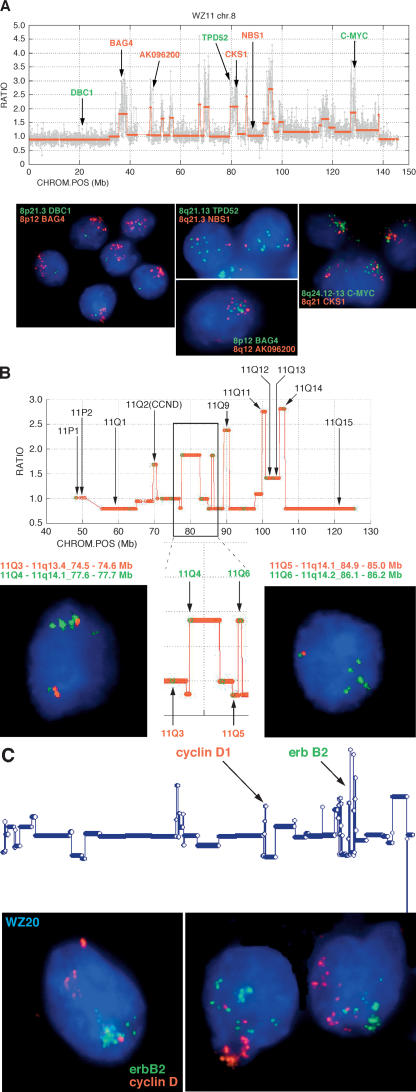
Figure 3.
Validation of peaks and valleys in ROMA profiles by interphase FISH. (A) Expanded ROMA profile of a firestorm on chromosome 8 in the diploid tumor WZ11. The graph shows the normalized raw data (gray) and segmented profile (red) along with the genes for which the probes shown in the FISH images were constructed. Several distinct conditions are exemplified in the images. First, the ROMA profile indicates that the 8p arm is deleted distal to the 8p12 cytoband yielding a single copy of DBC1 (green), but >10 tightly clustered copies of BAG4, which is located in the frequently amplified 8p12 locus (Garcia et al. 2005). Tight clusters of multiple copies corresponding to ROMA peaks are also shown in the FISH images for CKS1A, MYC, TPD52, and the uncharacterized ORF AK096200. Note that the FISH signals corresponding to distinct loci cluster together irrespective of their distance on the same arm (CKS1A/MYC) or across the centromere (BAG4/AK096200). Finally, the spaces between ROMA peaks on 8q, exemplified by NBN (formerly known as NBS1), uniformly show two copies as indicated by the ROMA profile. (B) Expanded view of the centromere and 11q arm from diploid tumor WZ17 showing correspondence of the copy number as measured by FISH with the copy number predicted by the ROMA profile. The y-axis represents the segmented ratios of sample versus control. Chromosome position on the x-axis is in megabases according to Freeze 15 (April 2003) on the UCSC Genome Browser (Karolchik et al. 2003). FISH probes were amplified from primers identified from specific loci using PROBER software (Methods).The insert outlined in black is magnified to show specific details. Comparative data for the probes shown in black are not shown but are available on our Web site. In the boxed region, note that in the nonamplified regions the ROMA profile predicts two copies of the arm proximal to the leftmost amplification. Consistent with the profile, the FISH image shows two copies of probe 11Q3, with one of the spots located in the cluster along with the amplified copies. The amplicon to the right yields four copies by FISH (probe 11Q4). The ROMA profile for the amplicon represented by probe 11Q6 suggests that it is in a region in which the surrounding nonamplified portion of the arm is deleted. This arrangement is commonly observed in firestorms and is confirmed by the FISH image showing one pair of the loci 11q5 and 11Q6 together, representing the intact arm, and no copy of probe 11Q5 in the amplified cluster of spots for 11Q6. (C) Profile of tumor WZ19 in which two firestorms are observed on chromosomes 11q and 17q. In contrast to the overlapping clusters shown in A, amplifications on unrelated arms visualized using FISH probes for CCND1 and ERBB2 cluster independently in the nucleus.

