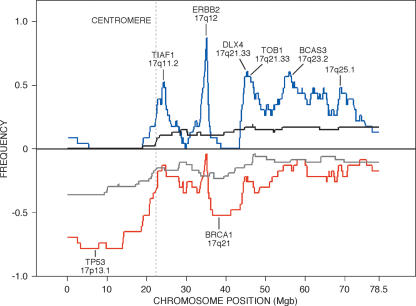
Figure 4.
Frequency plots of amplification and deletions in tumors containing clustered amplifications (firestorms) on chromosome 17. Lines represent histograms of the number of events for each probe in segmented ROMA profiles over threshold as in Figure 1 for two subsets extracted from the combined Scandinavian data set. Blue and red lines represent amplifications and deletions, respectively, in the subset of 23 tumors containing firestorms on chromosome 17, each showing clear peaks (valleys) of activity. Black and gray lines represent equivalent events in a set of 53 tumors in which firestorms are not observed on chromosome 17.

