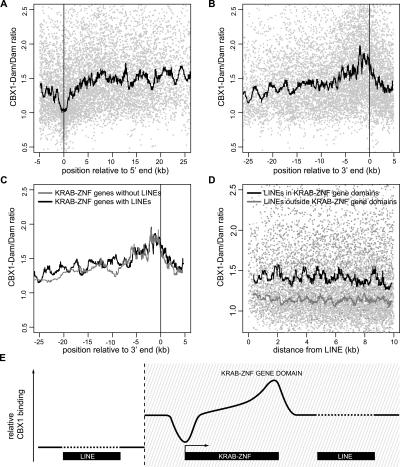
Figure 5.
Detailed analysis of CBX1 binding to KRAB-ZNF genes and LINEs. (A,B) CBX1 is depleted from promoter regions and enriched at 3′ ends of genes. All KRAB-ZNF genes on Chr19 were aligned by their 5′ (A) or 3′ (B) ends, and combined CBX1 binding data were plotted. Each light gray dot represents one tiling array probe and only tiling array probes that are located <5 kb upstream or within genes (A) or <5 kb downstream or within genes (B) are plotted. Black lines depict the sliding window median value (window size = 101 probes). (C) Enrichment at 3′ ends of KRAB-ZNF genes is independent of LINE sequences. Sliding window medians are shown for 95 KRAB-ZNF genes that do not contain any LINE-related sequences (gray) and 78 KRAB-ZNF genes that contain at least one LINE-related sequence (black). (D) LINEs in KRAB-ZNF gene domains are embedded in CBX1-bound sequences. Each dot represents one tiling array probe. Lines depict sliding window median CBX1 binding values of probes surrounding LINE-sequences (defined as having at least 1000 bp LINE homology) that are located <200 kb (black line, dark gray dots) or >200 kb (gray line, light gray dots) from a KRAB-ZNF gene. (E) Scheme of CBX1 binding to KRAB-ZNF genes and LINEs within and outside KRAB-ZNF gene domains.

