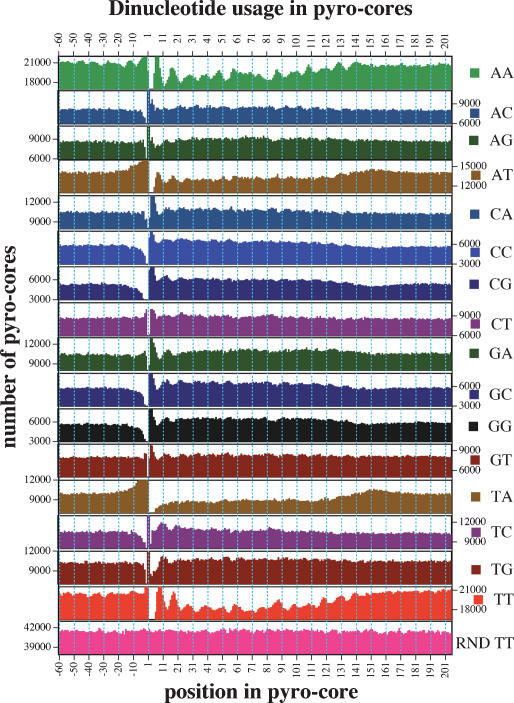
Figure 2.
Positional dependence of dinucleotide composition in core and flanking sequences. Graphs show incidence of each dinucleotide at every position in the set of 163,651 unique pyro-core sites. Positions 1–146 show incidence in the presumed core nucleosome, while flanking sequences show the 60 nt preceding and following the pyro-core (positions −60 to −1 and 147–206, respectively). RND TT is a parallel analysis performed on a simulated set of random core segments constructed in silico from C. elegans’ DNA. In each graph, the scale of the ordinate is the same and shows a 5000 core range.

