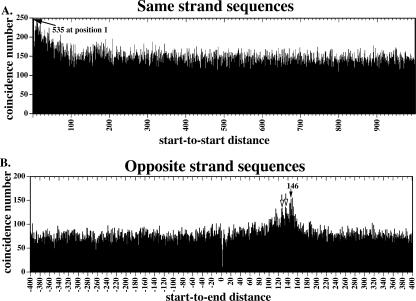
Figure 3.
Positional relationships between neighboring cores. (A) Relative positions of unique/unambiguous pyro-core start (Start-to-Start distances for cores sequenced on the same strand). Histogram shows total pairs of unique/unambiguous nucleosomes with a Start-to-Start distance corresponding to the value on the x-axis. A total of 535 pyro-core starts are found at position 1 and are noted on the graph by an arrow. (B) Start-to-End distances for cores sequenced on opposite strands. Histogram shows total pairs of unique/unambiguous nucleosomes with a Start-to-End distance corresponding to the value on the x-axis. A filled arrow notes a peak at 146 nt and open arrows note peaks ∼10 and 20 bp shorter, which suggest possible rotational setting preferences.

