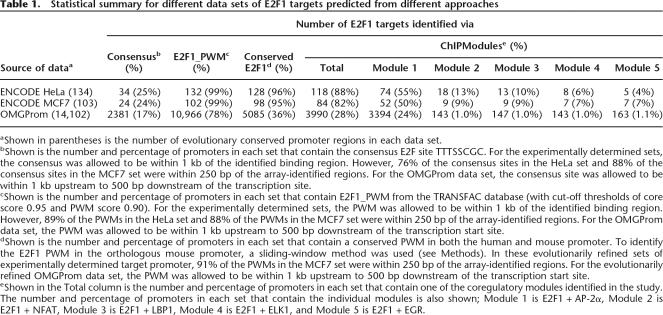
Table 1.
Statistical summary for different data sets of E2F1 targets predicted from different approaches
aShown in parentheses is the number of evolutionary conserved promoter regions in each data set.
bShown is the number and percentage of promoters in each set that contain the consensus E2F site TTTSSCGC. For the experimentally determined sets, the consensus was allowed to be within 1 kb of the identified binding region. However, 76% of the consensus sites in the HeLa set and 88% of the consensus sites in the MCF7 set were within 250 bp of the array-identified regions. For the OMGProm data set, the consensus site was allowed to be within 1 kb upstream to 500 bp downstream of the transcription site.
cShown is the number and percentage of promoters in each set that contain E2F1_PWM from the TRANSFAC database (with cut-off thresholds of core score 0.95 and PWM score 0.90). For the experimentally determined sets, the PWM was allowed to be within 1 kb of the identified binding region. However, 89% of the PWMs in the HeLa set and 88% of the PWMs in the MCF7 set were within 250 bp of the array-identified regions. For the OMGProm data set, the PWM was allowed to be within 1 kb upstream to 500 bp downstream of the transcription start site.
dShown is the number and percentage of promoters in each set that contain a conserved PWM in both the human and mouse promoter. To identify the E2F1 PWM in the orthologous mouse promoter, a sliding-window method was used (see Methods). In these evolutionarily refined sets of experimentally determined target promoter, 91% of the PWMs in the MCF7 set were within 250 bp of the array-identified regions. For the evolutionarily refined OMGProm data set, the PWM was allowed to be within 1 kb upstream to 500 bp downstream of the transcription start site.
eShown in the Total column is the number and percentage of promoters in each set that contain one of the coregulatory modules identified in the study. The number and percentage of promoters in each set that contain the individual modules is also shown; Module 1 is E2F1 + AP-2α, Module 2 is E2F1 + NFAT, Module 3 is E2F1 + LBP1, Module 4 is E2F1 + ELK1, and Module 5 is E2F1 + EGR.

