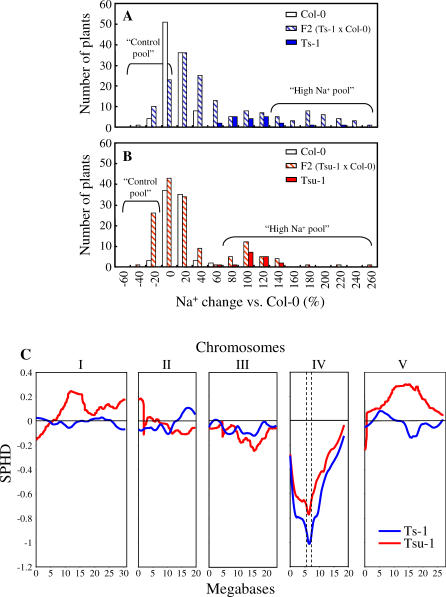
Figure 2. The Higher Na+ Accumulation in Shoots of Ts-1 and Tsu-1 Is a Monogenic Recessive Trait Caused by a Gene Located on Chromosome IV.
(A) Distribution of Na+ accumulation in shoot tissue of F2 segregating population obtained from crossing Col-0 with Ts-1. Presented data are distribution of Col-0 (n = 99), Ts-1 (n = 20), and F2 (Ts-1 × Col-0) (n = 158) plants.
(B) Distribution of Na+ accumulation in shoot tissue of F2 segregating population obtained from crossing Col-0 with Tsu-1. Presented data are distribution of Col-0 (n = 80), Tsu-1 (n = 16), and F2 (Tsu-1 × Col-0) (n = 143). Na+ contents were calculated for each plant as a percentage relative to Col-0 average Na+ content. The “Control pool” and “High Na+ pool” labels indicate the F2 plants used to prepare the corresponding DNA pools for the DNA microarray-based BSA.
(C) Hybridization of genomic DNA from Ts-1 (blue) and Tsu-1 (red) to DNA microarray (ATH1). Data are presented as a Scaled pool hybridization difference (SPHD), the difference between the hybridization of the two pools at the SFPs, scaled so that the difference between Col-0 and the accession would be equal to 1. SFPs were selected based on their D-statistic, which is a modified t-statistic that avoids spurious large values due to low hybridization levels [12]. Dashed vertical lines on Chromosome IV represent the mapping confidence interval of 0.875 Mbp on either side of the peak. Confidence intervals were calculated using algorithms derived from simulations by Borevitz et al. [12], and the scripts accessed at http://www.naturalvariation.org.

