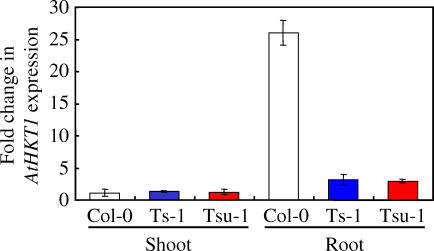
Figure 4. Root Differential AtHKT1 Expression between Col-0, Ts-1, and Tsu-1.
AtHKT1 level of expression was compared in shoots and roots of Col-0, Ts-1, and Tsu-1 plants. RNA was isolated from shoot and root of 60-d-old plants grown in soil under short-day conditions. For normalization across samples, the expression of the Actin 1 gene was used, and relative fold induction was calculated in comparison to AtHKT1 expression in Col-0 shoot using the ΔΔC t method. Presented data are the means of at least three biological replicates, and the error bars represent ±SD.

