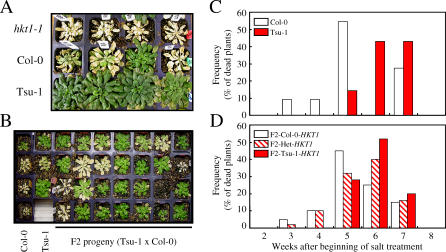
Figure 7. Contribution of Tsu-1 HKT1 Allele to Survival Under NaCl Stress.
(A) Relative NaCl tolerance of hkt1–1, Col-0, and Tsu-1. Five-week-old hkt1–1, Col-0, and Tsu-1 plants were treated biweekly with 100 mM NaCl. Picture was taken 6 wk after beginning of the salt treatment.
(B) NaCl tolerance of F2 plants from a Tsu-1 × Col-0 cross. Picture of one of four plant growth trays used in the experiment. Each tray includes plants from each parent (Col-0 and Tsu-1) as well as F2 plants.
(C) Distribution of the parental lines Col-0 (n = 11) and Tsu-1 (n = 14) recorded dead each week after beginning of the salt treatment. Presented data are percentage of plants dead each week after beginning of salt treatment.
(D) Distribution of F2 plants (Tsu-1 × Col-0, n = 95) genotyped as Col-0 homozygous or Tsu-1 homozygous or heterozygous for the HKT1 allele and recorded dead each week after beginning of the salt treatment. Presented data are percentage of plants dead each week after beginning of salt treatment.

