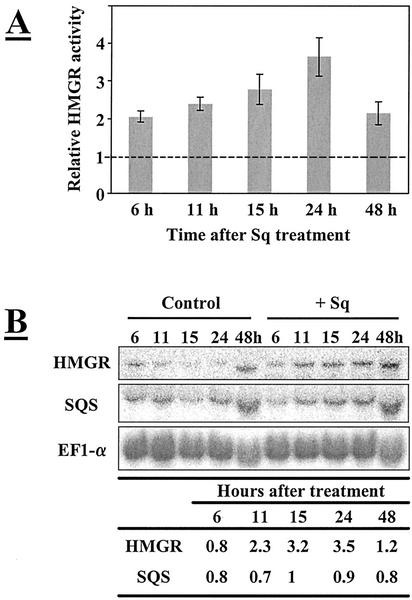
Figure 4.
Time course of Sq effects on HMGR activity (A) and HMGR and SQS mRNA levels (B). Three-day-old TBY-2 cells were treated during various times (from 0 to 48 h) by Sq (500 nm) and were used to isolate both microsomal fractions and total RNA. A, HMGR activity was measured as indicated in Figure 3. For each time, enzyme activities were expressed as relative values to the corresponding control (set at 1). Results are from two independent experiments ± sd. B, Total RNA (30 μg) was loaded per lane and transferred to a nylon membrane. Hybridizations were performed with 32P-labeled probes. All the hybridizations were performed on the same membrane. Relative intensities obtained by PhosphorImage analysis are given in the table after correction for background and normalization relatively to EF1-α mRNA content and compared with the corresponding control (set at 1).

