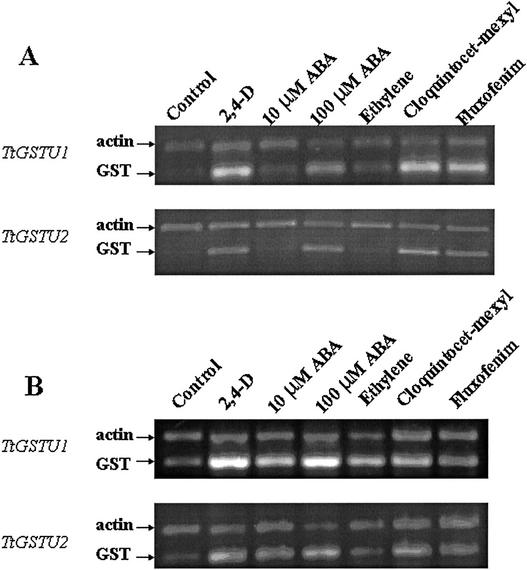
Figure 5.
Semiquantitative RT-PCR analysis of individual GST gene expression in T. tauschii. Expression was analyzed in shoots (A) and roots (B) of T. tauschii. Seedling growth conditions and treatments, and total RNA samples were the same as those used for RNA gel-blot analysis shown in Figure 4. Total RNA (5 μg) was used to synthesize first strand cDNA, and a fraction (1/20) of the first strand cDNA was used as template for PCR amplification of individual gene transcripts. Ethidium bromide-stained RT-PCR products were separated in 1.2% (w/v) agarose gels and analyzed with 1D image analysis software (Eastman-Kodak, Rochester, NY). The wheat actin gene was used as a constitutively expressed control gene and loading control.

