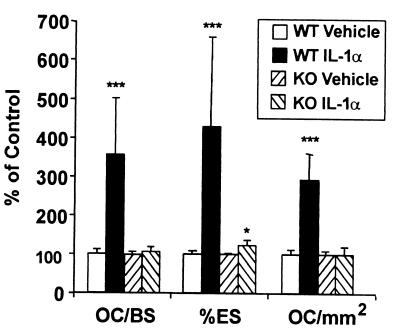
Figure 4.
Histomorphometric analysis of calvarial bones in WT and iNOS KO mice. OC/BS, number of osteoclasts per mm of bone surface; %ES, percentage of eroded surface; OC/mm2, number of osteoclasts per mm2 of tissue. All results are expressed as percentage of vehicle control from the same litter. Mice from two different litters were used in each group. *, P < 0.05 from vehicle; **, P < 0.01; ***, P < 0.001. WT saline, n = 7; WT IL-1, n = 8; iNOS KO saline, n = 6; iNOS KO IL-1, n = 7.

