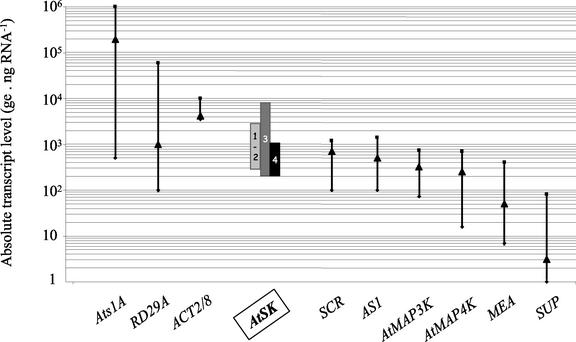
Figure 2.
Range of the absolute steady-state transcript levels for the 21 genes tested. Genes were tested for their steady-state transcript level in eight different organs and seven different growth conditions. The y axis is a log10 representation of the number of ge per nanogram of total RNA (ge ng RNA−1). The four AtSK gene subgroups are represented as vertical boxes. Subgroups 1 and 2 are both represented by the same box. For the other genes, the results are presented as a bar spreading from the highest to the lowest levels observed, with an arrowhead representing the average level. They are organized in descending order from the gene presenting the highest level (Ats1A), to the gene presenting the lowest level (SUP).

