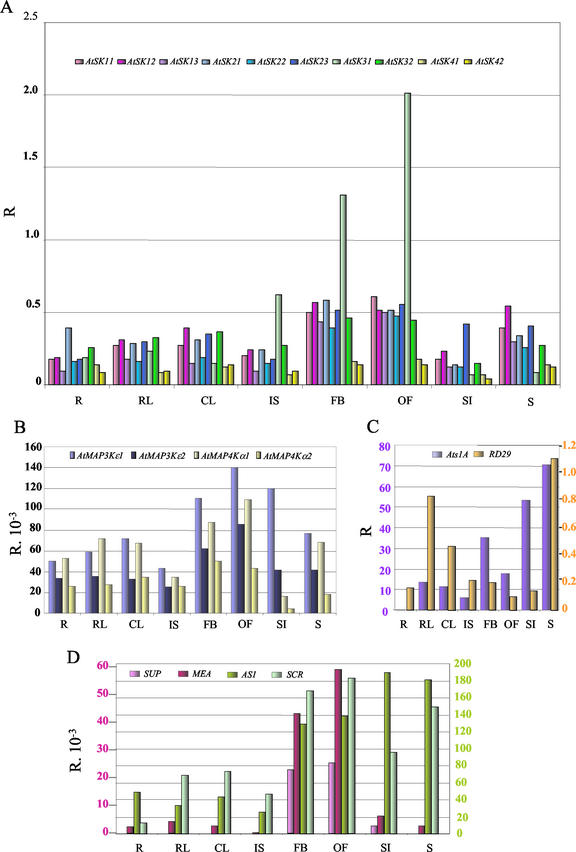
Figure 3.
Relative expression profile of the 10 AtSK genes compared with 10 reference genes in Arabidopsis organs. The transcript level is represented as a ratio (R) of the absolute value of the studied gene to the absolute value of the ACT2/ACT8 genes. Due to the ratio calculation, the sds are not represented on this figure. The transcript levels have been tested on RNA extracted from roots (R), rosette leaves (RL), cauline leaves (CL), inflorescence stems (IS), flower buds (FB), open flowers (OF), siliques (SI), and seedlings (S). A, Distribution of AtSK transcripts. B, Distribution of the AtMAP3Kε and AtMAP4Kα transcripts. C, Distribution of Ats1A and RD29A transcripts. Two scales are provided on the y axis, each with the color of the corresponding gene. D, Distribution of SUP, MEA, AS1, and SCR transcripts. Like in C, two scales are provided with colors matching the genes.

