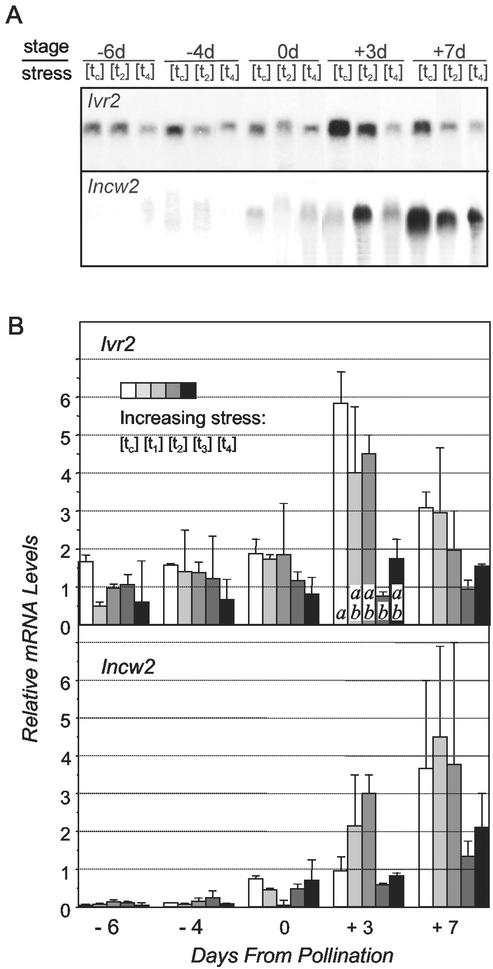
Figure 6.
A, Gel blots showing the effect of increasingly severe drought stress treatments on accumulation of Ivr2 and Incw2 mRNA in maize ovaries from −6 d before to +7 d after pollination ([tc] = control, [t2] = moderate stress, and [t4] = severe stress, as described below). The apparent size of both Ivr2 and Incw2 mRNA was about 2.1 kb. B, Relative levels of Ivr2 and Incw2 mRNA quantified from maize ovaries between −6 d before to +7 d after pollination based on two replicates (n = 2) of the following treatments: [tc], control; [t1], last irrigated July 28; [t2], last irrigated July 17; [t3], last irrigated July 03; and [t4], last irrigated June 21). Shading of bars (left to right) indicates increasing severity of drought stress treatment. F-tests and comparison of means for each stage were performed with the Gabriel-algorithm as described for Table I. The statistical analyses showed that Ivr2 mRNA level was significantly lower under severe stress (t3) than in control (tc), both on +3 d and for the entire period as a whole. For RNA gel blots, 20 μg of total RNA was loaded into each lane, and density of ribosomal RNA bands was used as a loading control. These were uniform in all instances.

