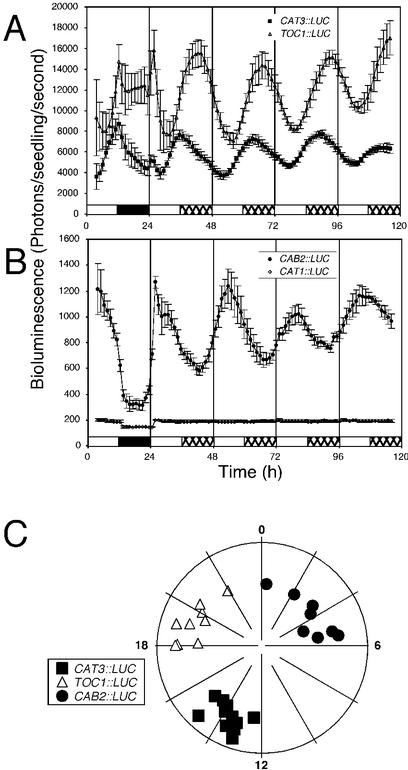
Figure 1.
Transcription of a CAT3::LUC transgene is regulated by the circadian clock. Plants were grown under 12-h light/12-h dark photoperiod at 22°C for 7 d. Plants were moved to a Packard TopCount luminometer and further entrained for 3 d in the LD cycle before being released into LL. The LD regime is indicated by the bars beneath the traces, with day (light) indicated by white bars, night (dark) indicated by black bars, and subjective night (dark of the entraining cycle) indicated by hatched bars. A, Traces present average values (± se, n = 12) from individual seedlings expressing CAT3::LUC (squares) or TOC1::LUC (triangles). B, Traces present average values (± se, n = 12) from individual seedlings expressing CAB2::LUC (circles) and CAT1::LUC (diamonds). C, Phase plot in which phases of individual seedlings are plotted against the strength of the rhythm. Phase is expressed in CT (phase/period × 24 h) around the circumference of a 24-h clock face. Strength of the rhythm is expressed as relative amplitude error (RAE), where a perfect sine wave is defined as 0 and a value of 1 defines the weakest rhythm considered to be statistically significant. The strength of the rhythm is plotted along the radius with the strongest rhythms (RAE = 0) at the outer edge of the circle and weakest rhythms (RAE = 1) at the center. CAT3::LUC, squares; CAB2::LUC, circles; TOC1::LUC, triangles. [−221/−103]2 CAT3::LUC seedlings are depicted because of their highly reproducible and accurate representation of endogenous CAT3 circadian-regulated transcription. Similar results have been obtained with all other rhythmic CAT3::LUC fusions tested.

