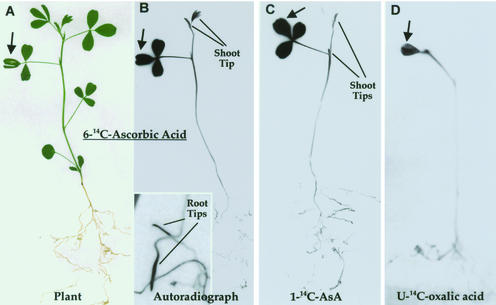
Figure 2.
AsA translocation in M. sativa. A source leaf (arrow) was exposed to [14C]AsA for 24 h. A plant (A) and its autoradiograph (B) showing distribution of label ([6-14C]AsA). Enlargement shows root tips. C, Patterns for [1-14C]AsA distribution. D, [U-14C]oxalic acid (product of carbons 1 and 2 of AsA).

