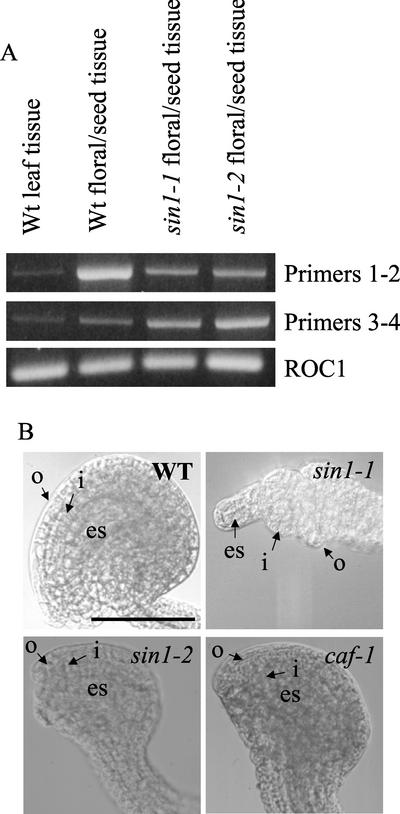
Figure 2.
Analysis of sin1 and caf mutants. A, RT-PCR analysis of SIN1/SUS1/CAF mRNA expression. The top row represents signal from RT-PCR with a primer set that amplifies +457 to +1,763 (1 and 2), and the middle row is signal with a set that amplifies +4,545 to +6,138 (3 and 4). The bottom row is signal from the constitutively expressed mRNA of the ROC1 gene. SIN1/SUS1/CAF mRNA is expressed at a higher level in floral tissue than in leaves, and it is not significantly lower in the sin1 point mutations. The relative levels of the two RT-PCR-amplified bands from mutant and wild-type flowers were not reproducibly different. B, Ovule morphology affected by the sin1 and caf mutant alleles in La-er. o, Outer integuments; i, inner integuments; es, embryo sac. Bar = 100 microns.

