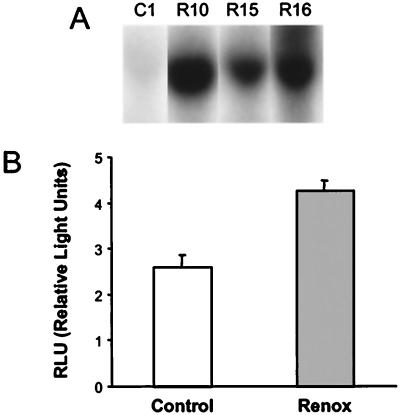
Figure 4.
Transfection of NIH 3T3 cells with pcDNA3.1-renox resulted in increased production of superoxide. (A) Detection of the renox message by Northern blotting in transfected NIH 3T3 fibroblasts. Lane C1 represents a control cell line transfected with the empty vector, and R10, R15, and R16 correspond to cloned renox-transfected cell lines. (B) Detection of superoxide production in renox-transfected cell lines. The control bar represents cells transfected with empty pCDNA 3.1 vector. The data represent the average response of three control and three renox-transfected cell lines (shown in A) analyzed in two separate assays.

