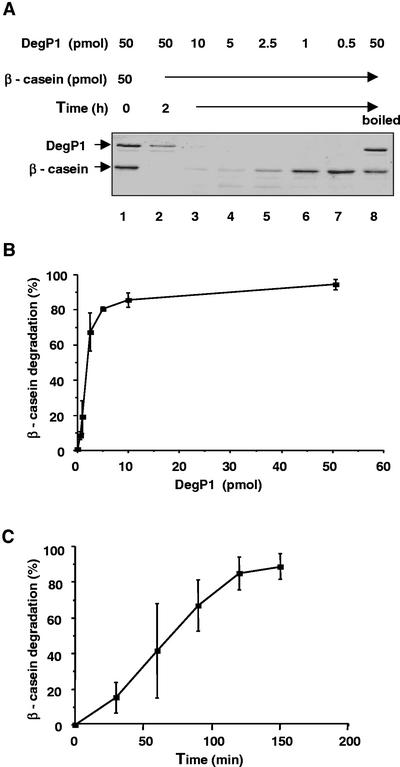
Figure 4.
Concentration and time dependence of β-casein degradation by DegP1. A, β-Casein (50 pmol) was incubated with 0.5 to 50 pmol of DegP1 for 2 h, after which the reaction mixtures were subjected to SDS-PAGE. A reaction containing 50 pmol of preboiled DegP1 is also included in the experiment. B, The experiment presented in A was repeated three times and the β-casein bands were quantified. Means ± se are presented. C, β-Casein (50 pmol) was incubated with 5 pmol of DegP1 for the indicated times, and the remaining β-casein was quantified. Means ± se of three experiments are presented.

