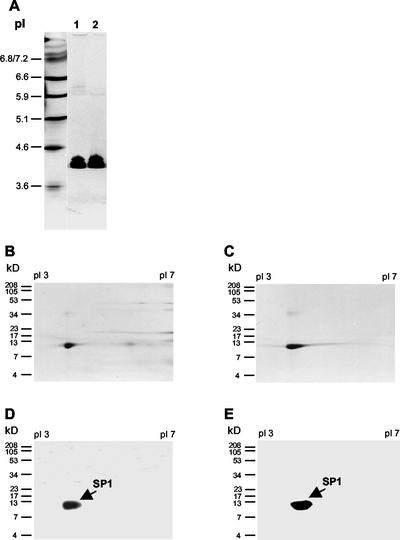
Figure 4.
Two-dimensional PAGE analysis of SP1. Proteins and IEF markers were first focused on an IEF gel (pH 3–7) and stained with Coomassie Blue; gel slices containing focused proteins were then subjected to additional SDS-PAGE. Proteins in SDS gels were visualized by either Coomassie Blue staining or western-blot analysis. A, Ten micrograms of electro-eluted 12.4- (lane 1) and 116- (lane 2) kD protein was resolved on an IEF gel (pH 3–7). IEF markers were run in parallel on the same gel. The pI of the markers is indicated on the figure. Gel slices that carried focused 12.4- (B) and 116- (C) kD proteins were further separated by 17% (w/v) Tricine-SDS-PAGE and stained with Coomassie Blue. Western-blot analysis of second-dimension gels containing focused total soluble (D) and total boiling-soluble (E) proteins using antirecombinant SP1 antibodies.

