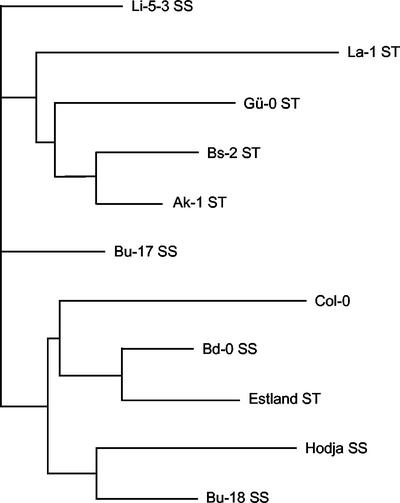
Figure 2.
Phylogenetic tree of accessions displaying extremely different responses to NaCl. Extremely salt-sensitive and -tolerant accessions are indicated as SS and ST, respectively. The phylogram was constructed using the NEIGHBOR program included in the PHYLIP 3.5c package, from a distance matrix calculated by the Microsat 1.5d program on the basis of the number of repeats found in 22 polymorphic microsatellites, using the neighbor-joining algorithm and the absolute distance (DAD) parameter.

