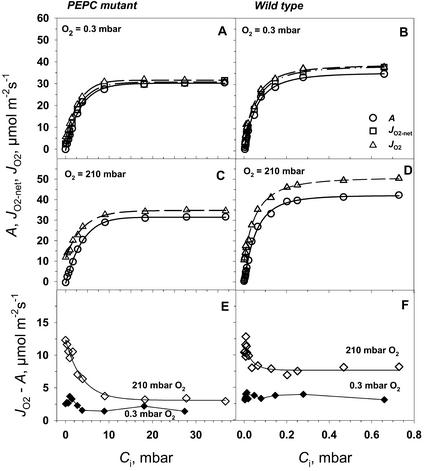
Figure 6.
The response of the rates of CO2 assimilation (A, ○), net O2 evolution (JO2-net, □), and gross O2 evolution from PSII (JO2, ▵) in PEPC mutant and wild-type A. edulis to intercellular CO2 (Ci) at two oxygen partial pressures, 210 and 0.3 mbar. The CO2 response curves were measured at PFD = 1,800 μmol m−2 s−1 and at leaf temperature 29°C.

