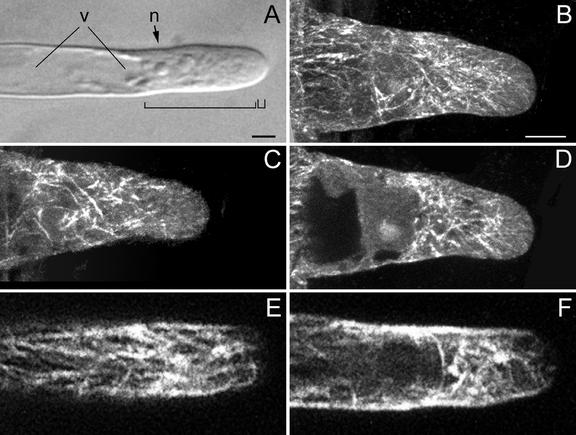
Figure 3.
MTs in growing root hairs visualized with a CLSM in scanning steps of 1 μm (B–F). B through D, Immunocytochemistry; E and F, GFP-MBD. A, Bright-field image of a living hair; the small bracket indicates the vesicle-rich region and the large bracket indicates the subapical cytoplasmic dense region. n, Nucleus; v, central vacuole. Bar = 10 μm. B, Full-stack projection of MTs. C, Projection of three sections of the cell periphery showing net-axially aligned CMTs. CMTs do not reach the very tip. D, Projection of four median sections showing EMTs. EMTs are abundant close to the nucleus and in the lower part of the subapical cytoplasmic dense region. The density of EMTs in the upper part of the subapical cytoplasmic dense region is low. Only a few EMTs reach the very tip. E, Projection of three sections of the cell periphery showing CMTs. For explanation see C. F, Projection of four median sections; for explanation see D. Magnification in B through F is the same. Bar in B = 10 μm.

