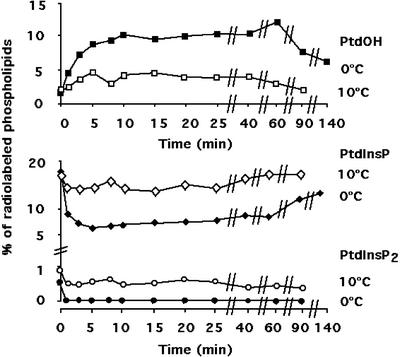
Figure 2.
Turnover of radiolabeled phospholipids during a cold treatment at 0°C (black symbols) or 10°C (white symbols). The turnover of PtdOH (square), PtdInsP (diamonds) and PtdInsP2 (circles) are displayed. Values were obtained after analysis of chromatography plates with a Storm system (Molecular Dynamics) and quantification of the labeled spots. PtdOH level was quantified from an autoradiograph of a plate submitted to migration in the acidic TLC system, whereas PtdInsP and PtdInsP2 levels were quantified from an autoradiograph of a plate used in the alkaline TLC system. Results from a typical experiment for each condition are displayed.

