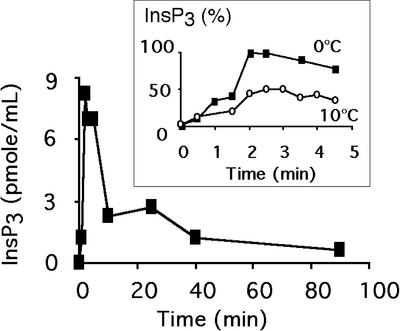
Figure 3.
InsP3 production of cells submitted to an exposure at 0°C. At different times after the temperature shift, InsP3 was extracted and quantified with an InsP3 radioreceptor assay kit according to the manufacturer's recommendations. Data from a typical experiment are displayed. Inset, Comparison of InsP3 production in cells shifted to 0°C (black symbols) or 10°C (white symbols). At different times after the temperature shift, InsP3 was extracted and quantified with an InsP3 radioreceptor assay kit according to the manufacturer's recommendations. Data from a typical experiment are displayed. Data were normalized by the maximum InsP3 amount detected during the treatment at 0°C.

