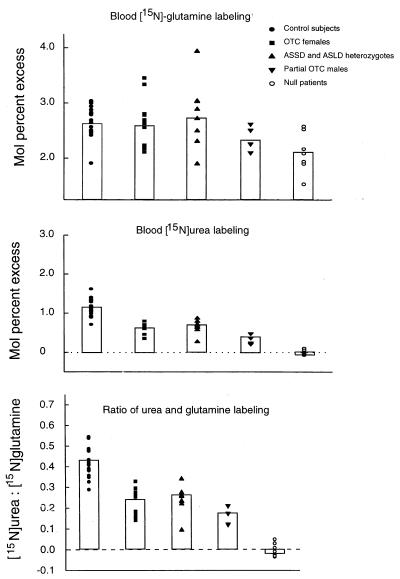
Figure 1.
Isotopic enrichment and 15N-U/G ratio in subject groups on 0.4 g/kg/day protein intake. (Top) The respective steady state mole percent excess enrichment of blood [15N]glutamine is shown for each study group with the mean illustrated by bars. (Middle) The respective steady state mole percent excess enrichment of blood [15N]urea is shown for each study group. (Bottom) 15N-U/G ratio representing proportion of [15N]urea to [15N]glutamine labeling for the respective study groups.

