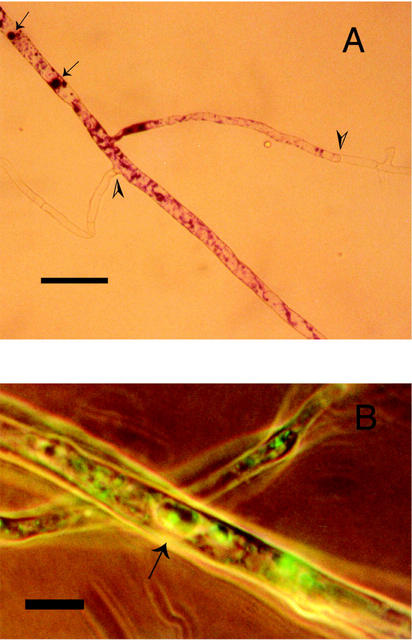
Figure 6.
A, Hyphae after low-P treatment with metachromasy, indicating the localization of polyphosphate (arrows). Metachromatic hyphae with cytoplasm separated from empty hyphae by cross-walls (arrow heads) can be seen. B, Localization of alkaline phosphatase activity by enzyme-labeled fluorescence substrate (ELF) staining (arrow) of a sample from the low-P treatment. Transmitted long-wavelength light was combined with UV light. Scale bar in A = 25 μm and in B = 9 μm.

