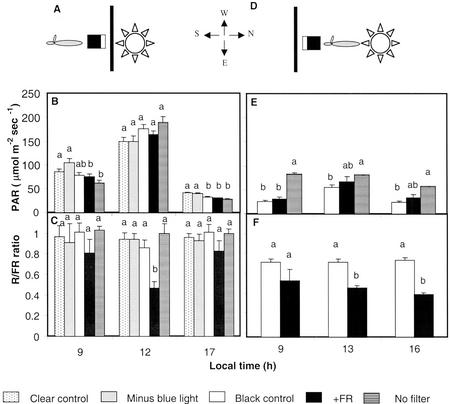
Figure 2.
Light environment created by selective filters placed toward the north (A–C) or the south (D–F) of isolated maize plants grown in the field. A and D, Schematic representation of the position of the filters. The photosynthetically active radiation (PAR) and R/FR sensors were placed close to the plants (<1 cm), with their sensing surface (white rectangles) facing toward the filters. B and E, PAR. C and F, R to FR ratio. Data are means and se of four measurements. Different letters above bars indicate significant differences (P < 0.05) among filters for each local time.

