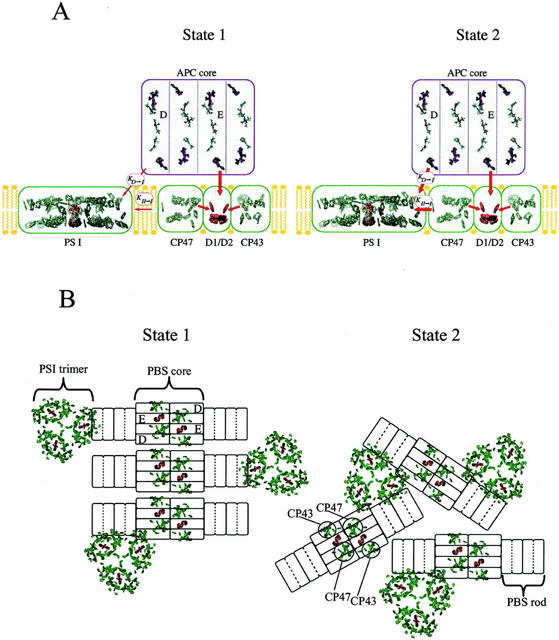
Figure 5.
A model for the organization of chromophores associated with the cyanobacterial thylakoid membrane and for the state transition based on the x-ray structures of PSII, PSI, and APC. A, “Side view” in the plane of the thylakoid membrane showing possible associations between the chromophores in one PSII complex, one PSI complex, and one APC core cylinder in states 1 and 2. Antenna chromophores in PSII and PSI are shown in green and reaction center chromophores are shown in red. Chromophores in PSII are shown divided into three compartments, D1/D2, CP47, and CP43, to reflect the energetic isolation of the two Chl a-containing antenna from the reaction center pigments. Energy transfer from the APC core to PSII occurs from the ApcE subunit to D1/D2. Energy transfer from the APC core to PSI is via the ApcD subunit and is defined by the rate constant KD-I. Energy transfer from PSII to PSI, spillover, is assumed to occur from CP47 to PSI and is defined by the rate constant KII-I. The state transition is proposed to control both KD-I and KII-I. Both rate constants are larger in state 2 than state 1. B, “Top view” down onto the surface of the thylakoid membrane and includes antenna chromophores (in green) and reaction center chromophores (in red) associated with PSII dimers and PSI trimers. APC core cylinders are shown associated with PSII dimers and phycocyanin rods with the core cylinders. In state 2, trimeric PSI is found in close contact with both CP47 of PSII and the ApcD subunits of the core cylinders. In state 1, the PBS-PSII supercomplexes are organized into rows that exclude the PSI trimer from the immediate vicinity of ApcD and CP47. One of the PBS-PSII supercomplexes is shown to remain associated with one of the PSI trimers via ApcD to represent the idea that some complexes may be more involved than others in the state transition. The organization of the PBS-PSII supercomplex and the association of PSI trimers with ApcD and the terminal rod disc in this figure has been adapted from Bald et al. (1996).

