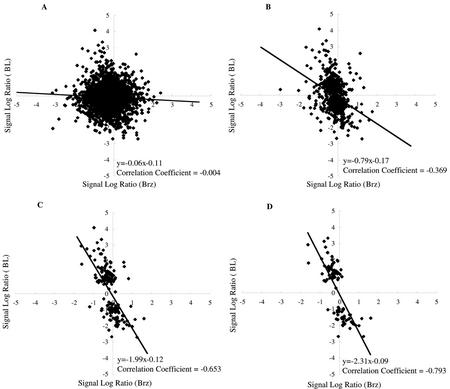
Figure 2.
Comparison of BL and Brz treatment with the use of GeneChip experiment. The distribution of signal log ratio values for treatments with BL (y axis) and Brz (x axis) are shown. A, All of the genes (>8,000) on the GeneChip are plotted. B, Genes that are induced or reduced more than 2-fold in a single GeneChip experiment are plotted. C, Genes that are induced or reduced more than 2-fold in two of the three GeneChip experiments are plotted. D, The BR-regulated genes (induced or reduced more than 2-fold in three GeneChip experiments, listed in Tables I and II) are plotted. The signal log ratio represents the ratios of hybridization signals using a log (base 2) scale. A signal log ratio of 1 represents a gene whose expression is increased 2-fold by treatment with either BL or Brz, and a signal log ratio of −1 represents a gene whose expression is reduced 2-fold by treatment with either BL or Brz.

