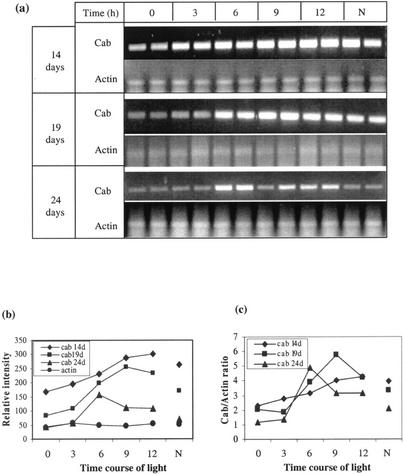
Figure 5.
Time course of Cab and Actin gene expression upon illumination in barley leaf mesophyll samples from the third leaf of different aged plants (14, 19, and 24 d old). Full expansion of the leaf was around 18 d. Each plant had been maintained in continuous darkness for 40 h before illumination and analysis, except for those labeled N, which were sampled 9 h into the light period of normal diurnal plants. Each time point represents three pooled single-cell samples replicated from two different plants. a, Ethidium bromide-stained gel. b, The mRNA abundance was quantified as in Figure 2 (the data from the two plants were averaged). c, Cab to Actin ratio of gene relative expression level.

