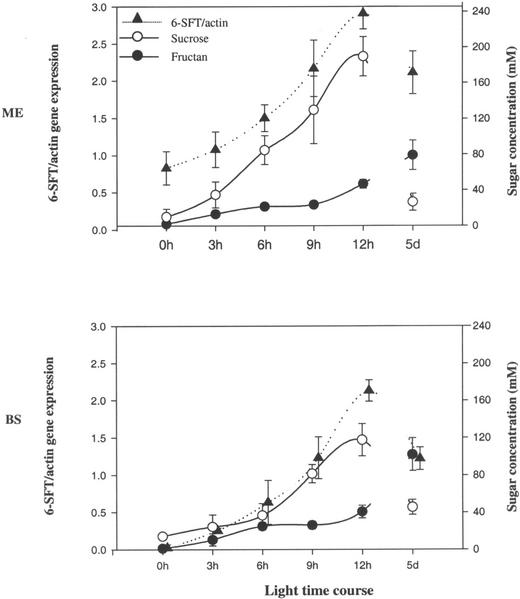
Figure 6.
A relationship between 6-SFT expression (relative to actin) and sugar concentration (Suc and fructan) in mesophyll (ME) and parenchymatous BS cells during time course of light and 5 d (5d) continuous light. Each data point is an average ± sd for three to four samples from different leaves.

