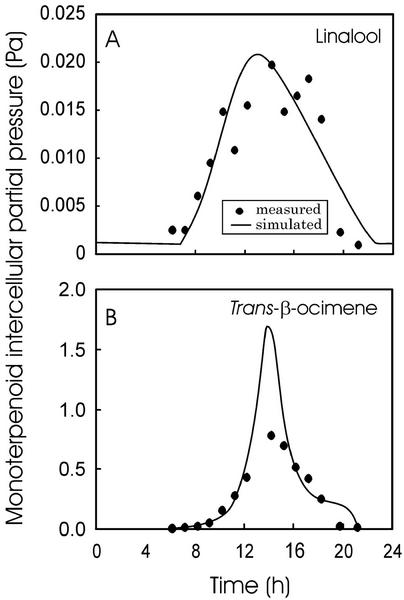
Figure 10.
Linalool (A) and trans-β-ocimene (B) Pi values during August 3 (emission data in Fig. 4, C and F). The partial pressure was determined according to Equation 2 (measured) or from Equation 8 using the simulations in Figures 8, G to I, and 9 (GV changed to track the measurements). Pi is the intercellular partial pressure in equilibrium with cell wall monoterpene concentrations. The total emission data are depicted in Figure 4, C and F.

