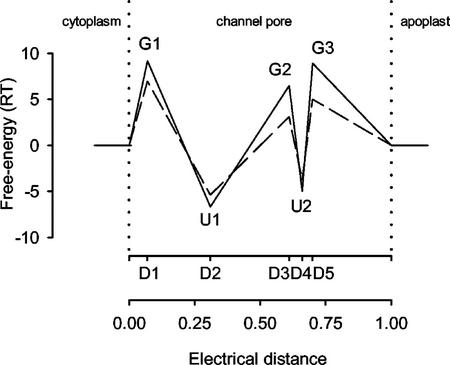
Figure 1.
Schematic representation of the free-energy profiles for K+ (− − −) and Ca2+ (——) permeation through the pore of an unoccupied VIC channel in the plasma membrane of a wheat root cell in the absence of an electric field. The positions of free-energy maxima (G1–G3) and minima (U1 and U2) are indicated (D1–D5). The solution reference state is 55.5 m.

