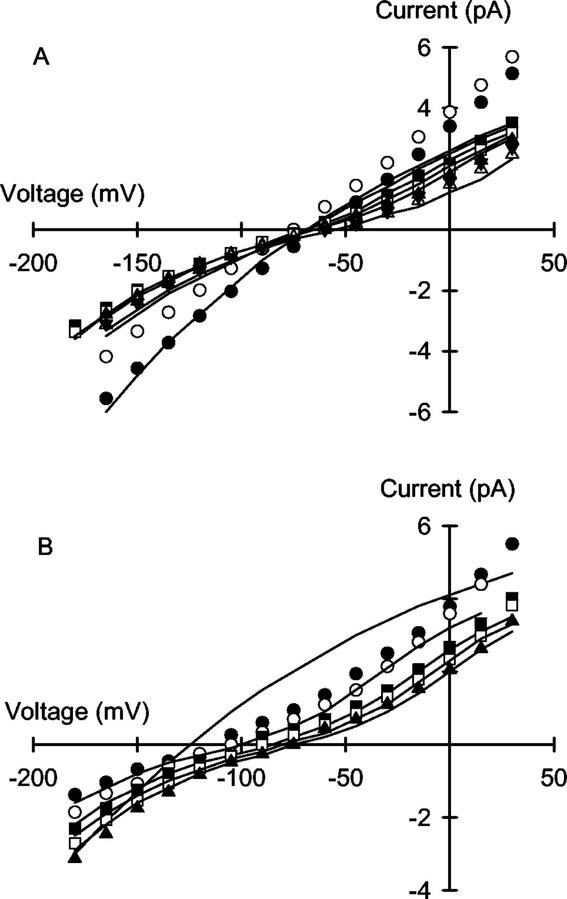
Figure 7.
The effect of varying extracellular (cis) Ca2+ concentration on the unitary current versus voltage relationships for the VIC channel in the plasma membrane of wheat roots assayed in the presence of: A, 10 NaCl:100 KCl; or B, 1 NaCl:100 KCl. Calcium chloride was added to the solution in the cis chamber to give final concentrations in: A, 0 (●), 0.1 (○), 0.5 (▪), 1 (□), 2 (▴), 5 (▵), and 10 (▾) mm; and B, 0 (●), 0.1 (○), 0.5 (▪), 1 (□), and 2 (▴) mm. Curves were derived from a 3B2S model for cation permeation using the parameters given in Table I.

