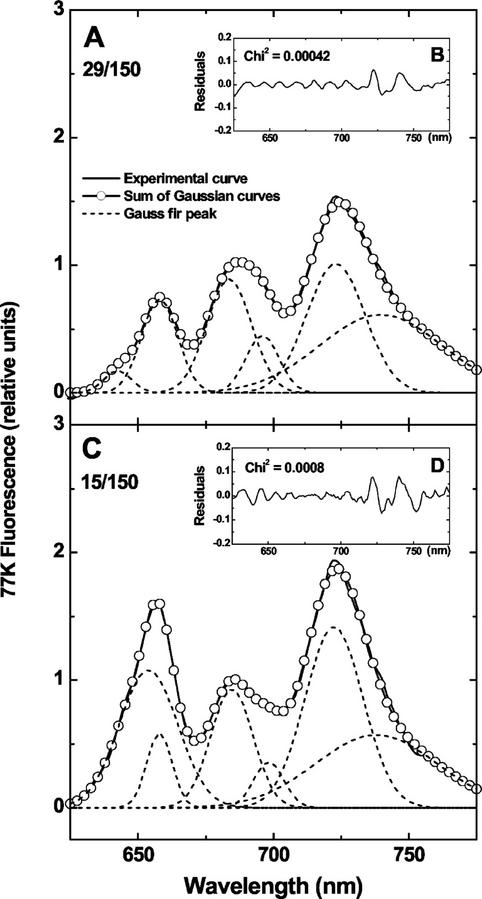
Figure 3.
Low temperature (77K) fluorescence emission spectra and their decomposition in Gaussian sub-bands of P. boryanum cells grown under various conditions of temperature (°C)/irradiance (μmol m−2 s−1). The excitation wavelength was 580 nm. The experimental curves (—), representing an average of three scans, were normalized to the emission band around 685 nm. Both the sum of the Gaussian bands (–ο–) and the individual sub-bands (− − − −) are shown. The differences between the sum of the components and the emission curves are shown as residuals in the figure inserts.

