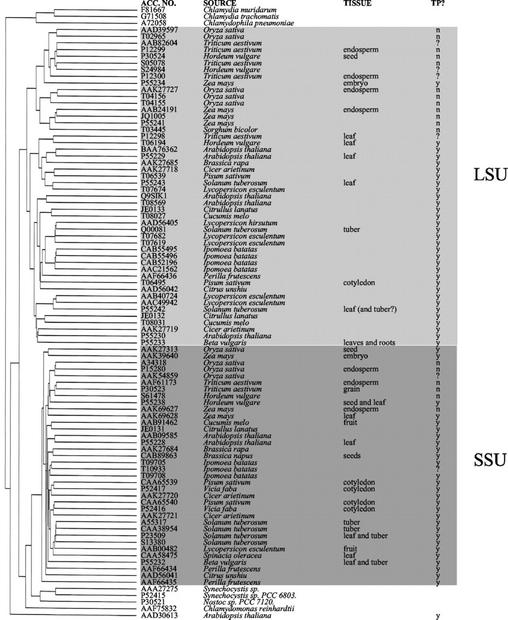
Figure 1.
Comparison of the derived amino acid sequences of subunits of ADP-Glc pyrophosphorylase (AGPase). The dendrogram was generated using the PileUp program of the Wisconsin Package Version 10.1 (Genetics Computer Group, Madison, WI), which creates a multiple sequence alignment from a group of related sequences using progressive, pair-wise alignments. The tree shows the clustering relationships for subunits of AGPase. With one exception (AAD31613), the plant subunits of AGPase divide into two major groups, representing the LSU (pale gray) and SSU (dark gray). Presence of a transit peptide (TP) was predicted using the ChloroP server (Emanuelsson et al., 1999). y, Yes; n, no; ?, not determined due to incomplete sequence; Tissue, tissue from which transcript was isolated.

