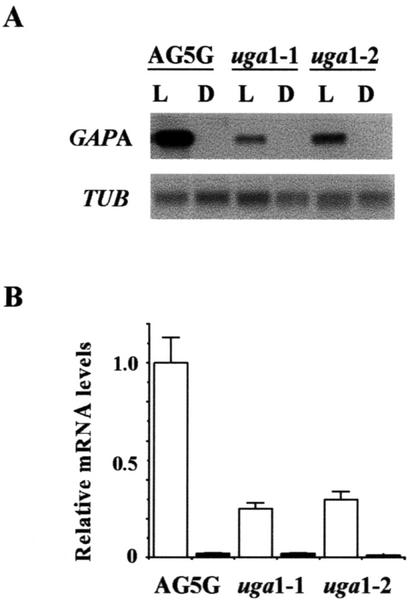
Figure 2.
Effects of uga mutations on the expression of GAPA in seedlings. A, Total RNAs from seedlings grown in continuous light (L) or complete darkness (D) for 5 d were isolated and analyzed by northern-blot analysis. Representative data are from gels loaded with 5 μg RNA lane−1 and probed with radiolabeled GAPA or TUB. B, Each northern-blot analysis was repeated three times using RNA samples from plants grown at different times. Relative densitometric values were obtained by first taking the ratio of GAPA signal intensity over that of the corresponding TUB signal for each lane, and then dividing that by the ratio to obtain obtained for light-grown AG-5G. Therefore, relative densitometric value for light-grown AG5G is taken as 1. Error bars = sds.

