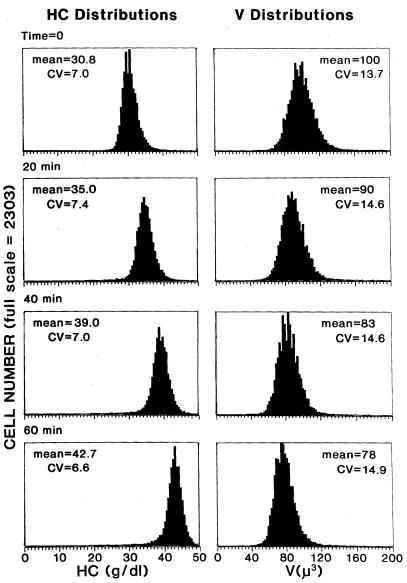
Figure 1.
Progressive changes with time in the HC and V distributions of normal RBCs after K+-permeabilization with valinomycin. Histograms were obtained with the Bayer H*3 analyzer during a 1-h incubation at 37°C of RBCs suspended in buffer D (15 mM K) and treated with valinomycin. Note the progressive increase in HC and decrease in V, with no evident broadening of cell distribution. CV, coefficient of variation. Samples taken at the times indicated were diluted in the same buffer containing sphering agent and were read immediately without RNA staining.

