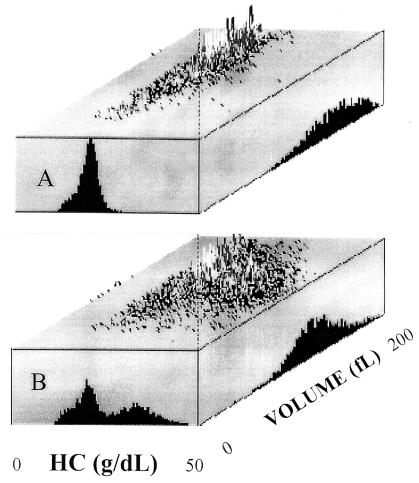
Figure 5.
Cell volume and HC histograms and three-dimensional cytograms of the SS R1 RBCs before (A) and after (B) K+-permeabilization with valinomycin. The different RBC volume distributions corresponding to the valinomycin-sensitive and the val-res fractions can be distinguished on the cytogram, despite their overlap on the volume histogram: note the broad volume distribution of the lighter (val-res) cells, compared with the cells that have dehydrated.

