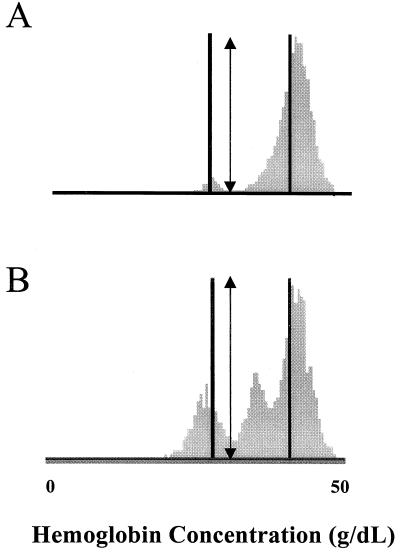
Figure 7.
Effects of K+-permeabilization with valinomycin on the HC distributions of the lightest fraction of normal RBCs from two individuals. Solid vertical lines show HC gates at 28 g of Hb per dl and 41 g of Hb per dl. The arrows indicate a gate of 32 g of Hb per dl, chosen to distinguish the most valinomycin-resistant fraction from the valinomycin-sensitive majority of RBCs. Histograms A and B exemplify the heterogeneity of distribution of the normal val-res populations and show that in some samples (B) a distinct population of intermediately val-res cells can be resolved.

