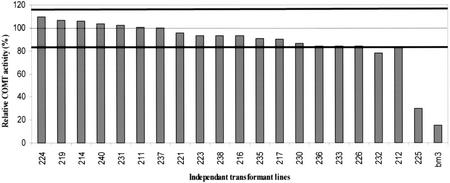
Figure 3.
COMT activity in COMT AS transformants. Enzyme activity using caffeic acid as substrate was measured in 20-d-old R2 transformants and the bm3 mutant, and expressed as a percentage of the mean value of the control population (dashed horizontal line). The two solid lines indicated the sd of the control population. COMT activity values of each transgenic line (histogram) represents the mean of three plants and two activity measurements per plant.

