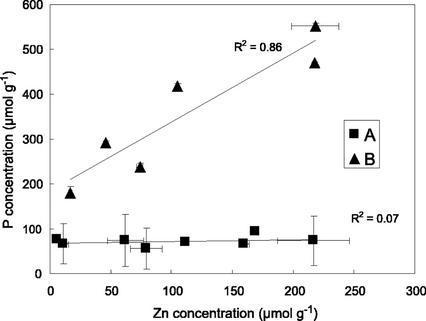
Figure 1.
Relationship between Zn and P concentrations in the plant samples. Two groups of points can be defined: The first one (group A) represents the aerial parts of all plants and the roots of A. halleri from the contaminated soil. For these samples, Zn and P are not correlated (R2, regression coefficient = 0.07). The second group (group B) represents the roots of all plants, except those of A. halleri from the contaminated soil. A Zn-P correlation clearly exists for these samples (R2 = 0.86).

