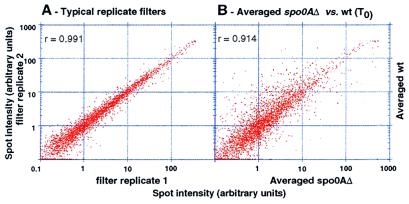
Figure 1.
Logarithmic-scale plots of normalized spot intensities (arbitrary units). (A) Typical replicate filters are shown with the intensity of each spot plotted versus the equivalent spot in a replicate filter. (B) Averaged spot intensities from a filter hybridized with probe from wild-type cells at T0 versus averaged spot intensities from a filter hybridized with probe from the Spo0A mutant at T0. Each graph represents 4,100 individual spots. r is the Pearson correlation coefficient.

