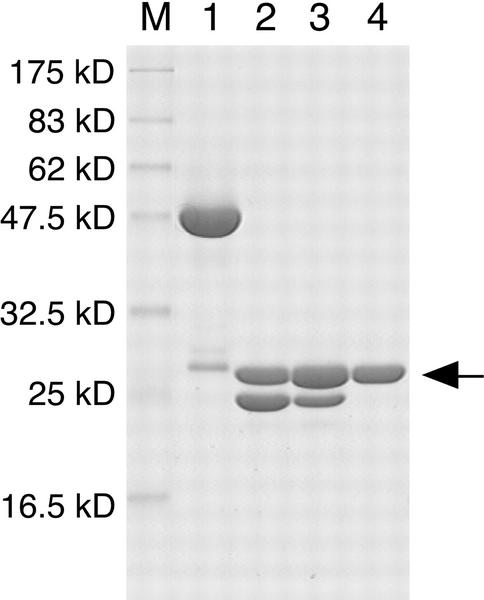
Figure 1.
Purification of recombinant AtHO1 protein. SDS-PAGE analysis of recombinant AtHO1. Lane M, Molecular mass markers. Lane 1, GST: AtHO1 after glutathione-Sepharose affinity chromatography. Lane 2, GST: AtHO1 after thrombin digestion. Lane 3, Flow-through fraction of glutathione-Sepharose affinity chromatography of sample shown in lane 2. Lane 4, Purified AtHO1 after Q Sepharose column chromatography. Arrow indicates the position of AtHO1. The protein fraction shown in lane 4 was used for further study.

