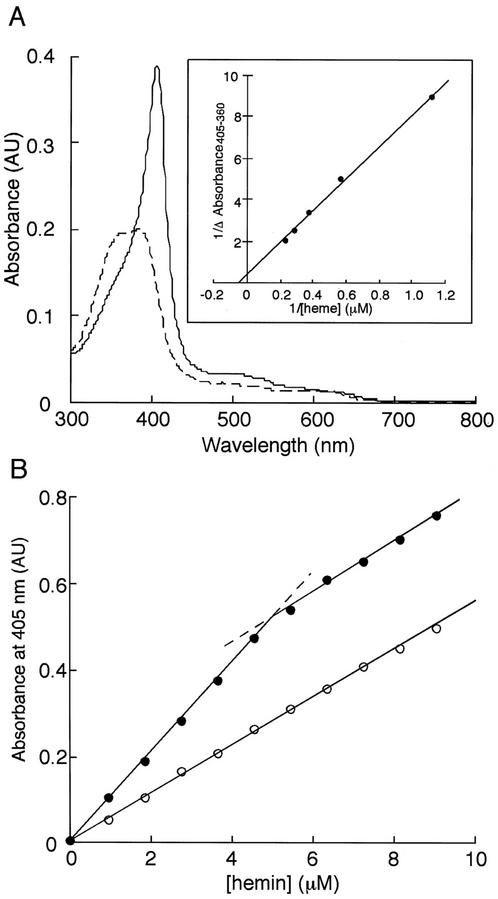
Figure 2.
The heme-AtHO1 complex. A, Absorption spectrum of the heme-AtHO1 complex (solid line) and free heme (dotted line). Inset, Reciprocal plot for heme binding determined by difference absorption spectroscopy. B, Spectrophotometric titration of AtHO1: black circles, hemin with 5 μm AtHO1; and white circles, hemin only. The dashed lines indicate the extensions of the two linear phases of the AtHO1:hemin titration data.

